
Introduction
Heart Rate Variability (HRV), and specifically the root mean square of successive differences (RMSSD), remains a cornerstone metric for assessing autonomic nervous system function, stress, and recovery.
In our previous article, Demystifying Garmin’s Enhanced BBI, we demonstrated that Garmin’s Enhanced Beat-to-Beat Intervals (eBBI) deliver near-ECG accuracy during low-motion conditions. We showed how eBBI preserves critical high-frequency components - such as respiratory sinus arrhythmia (RSA) - and provides per-beat confidence flags that reliably reflect signal quality.
Building on those insights, this article addresses a critical concern raised in recent validation studies: the presence of systematic biases in legacy Garmin-derived nightly RMSSD when compared to ECG reference data.
The Challenge: Reported Bias in Legacy Garmin HRV
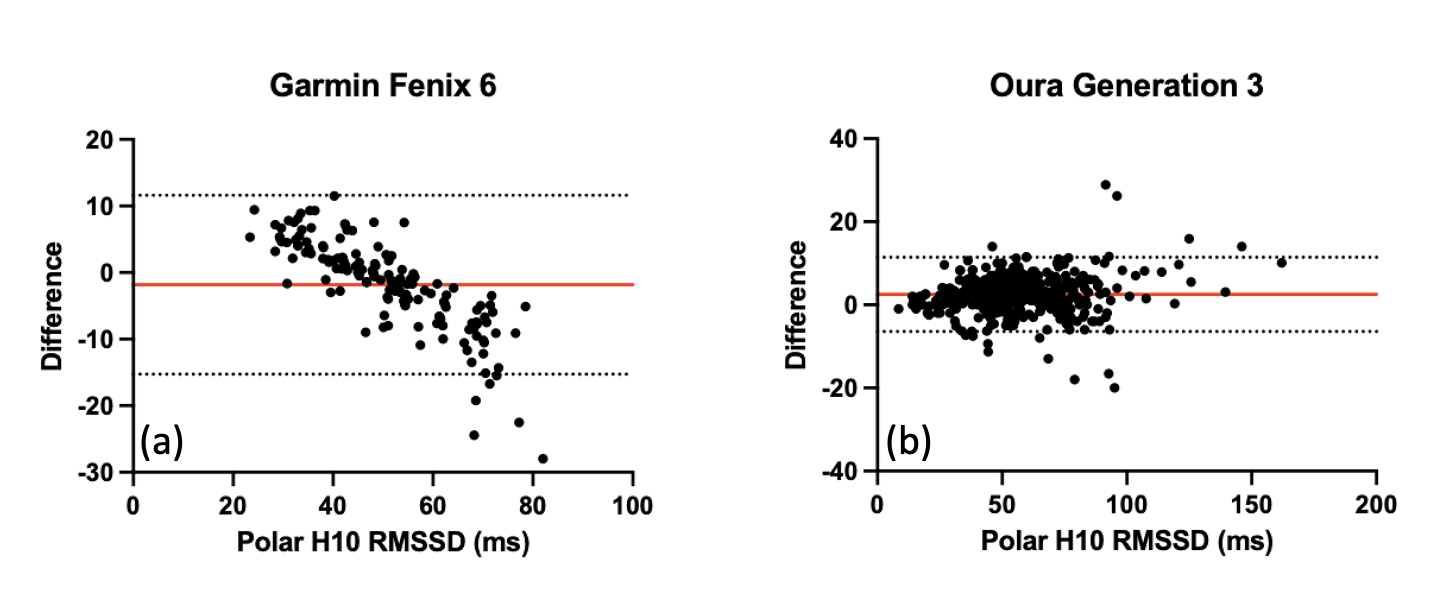
A 2025 validation study compared nocturnal resting heart rate and HRV across five wearable devices against a Polar H10 ECG reference [1]. While devices like Oura Ring (Gen 3/4), Whoop, and Polar Grit showed differences distributed around zero in Bland-Altman analyses, the Garmin Fenix 6 exhibited a distinctive, problematic pattern (Fig. 1):
- Overestimation when true RMSSD was low
- Underestimation when true RMSSD was high.
This systematic bias raised valid questions regarding the reliability of legacy Garmin data for precise autonomic monitoring, prompting researchers to seek clarification [2].
Independent Validation: Legacy vs. Enhanced BBI
To investigate this, Labfront conducted a month-long overnight data collection study using a Garmin Venu 3 worn simultaneously with a validated chest-based ECG device (Movesense). Our dataset included:
- Ground Truth: ECG-derived R-R intervals (RRI).
- Legacy Data: Garmin legacy BBI and official 5-minute RMSSD from Garmin Connect (GC).
- Enhanced Data: Garmin Enhanced BBI (eBBI) with per-beat confidence flags.
We calculated average 5-minute RMSSD values during sleep to match the protocol of the original validation study and performed Bland-Altman analyses.
1. Results with Legacy BBI
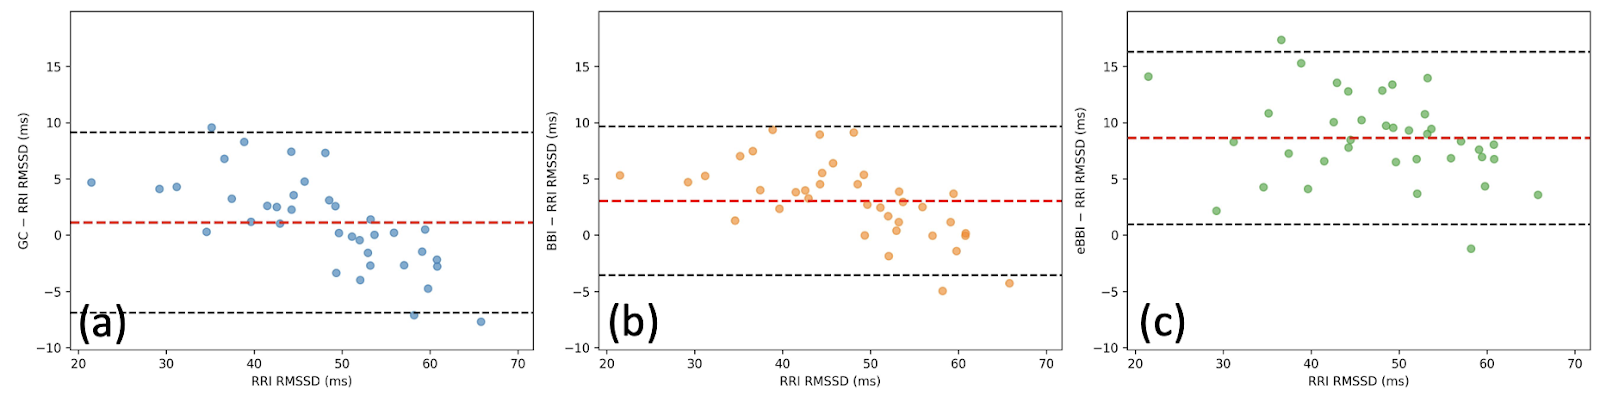
Our analysis confirmed the findings of the 2025 study. Both the Garmin Connect RMSSD and RMSSD derived from legacy BBI replicated the reported bias: positive differences at low variability and negative differences at high variability (Fig.2).
The cause: The underestimation at high RMSSD values aligns with known processing limitations in legacy BBI. To maximize data availability, legacy algorithms applied bandwidth-limiting filters [2]. While effective for stability, these filters inadvertently suppressed large beat-to-beat fluctuations, artificially lowering RMSSD during periods of high autonomic variability.
2. Results with Enhanced BBI
When the same dataset was processed using Enhanced BBI (eBBI) - filtering out low-confidence beats and requiring 70–90% high-confidence coverage per 5-minute window - the results changed dramatically.
The pattern of systematic bias disappeared. The Bland-Altman distribution became flat, showing no systematic underestimation across the entire RMSSD range (Fig.2).
A New Observation: The Physiological “Positive Offset”
While the non-linear bias was resolved, eBBI-derived RMSSD exhibited a consistent positive offset relative to the ECG reference (mean difference ≈+8 ms) (Fig.2c).
We hypothesize that the "overestimation at low RMSSD" reported in previous literature is actually a misinterpretation of this phenomenon. Unlike the legacy "bandwidth limiting" issue, this positive offset is not a processing error; rather, it appears to be a physiological characteristic of measuring Pulse Rate Variability (PRV) at the wrist versus Heart Rate Variability (HRV) at the chest.
Investigating the Signal Source
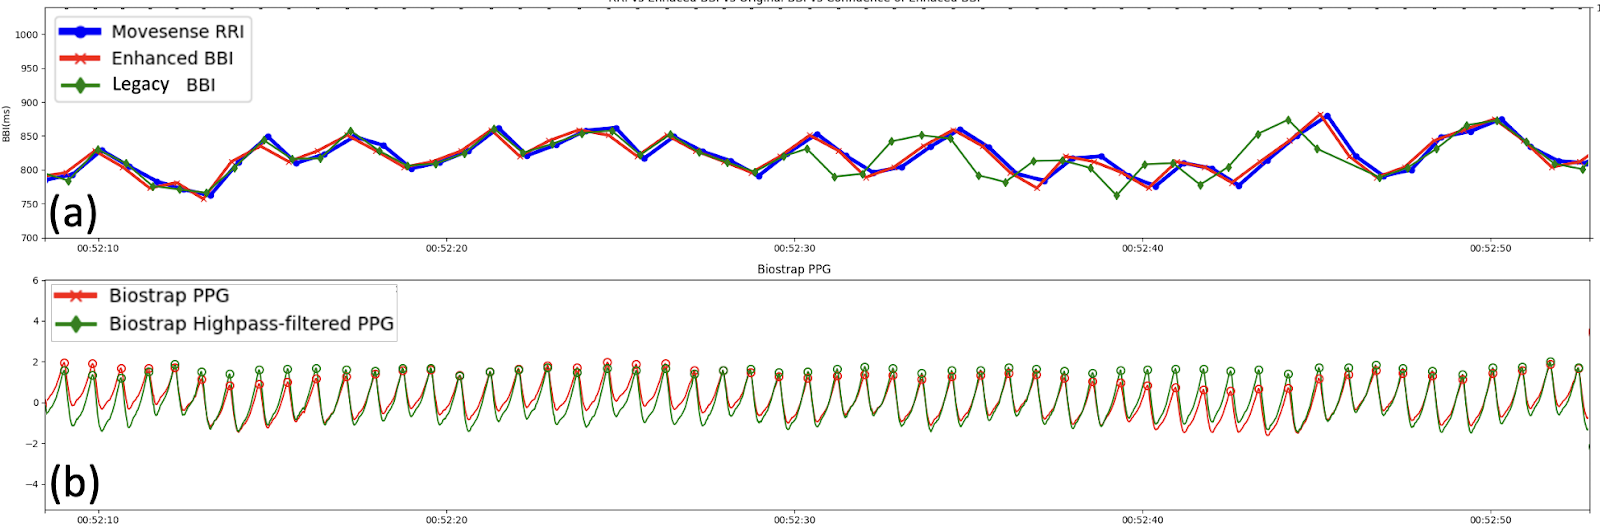
To understand this offset, we examined the underlying raw PPG signal. We collected raw PPG from a Biostrap device worn on the same wrist to serve as a proxy for the optical conditions encountered by the Garmin sensor.
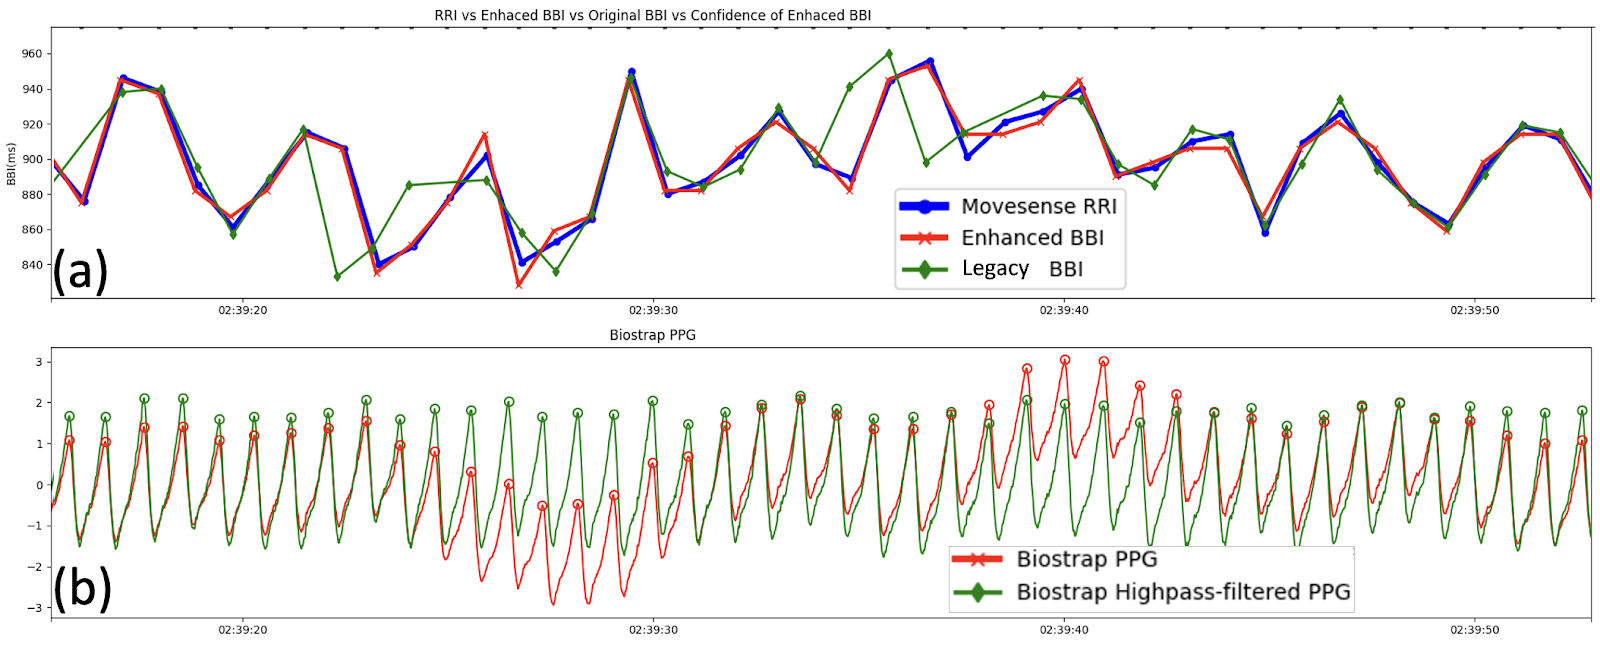
- Stable Conditions: When the PPG signal was perfectly stable, legacy BBI and eBBI closely matched the ECG RRI (Fig.3).
- Baseline Wander: When the PPG signal exhibited low-frequency baseline drift—often driven by respiration - Garmin eBBI showed greater short-term fluctuation amplitude than the ECG even during high-confidence periods with stable sensor contact (Fig.4).
The Role of Pulse Transit Time (PTT)
This additional variability is physiological. Respiration affects not only the heart rate (RSA) but also intrathoracic pressure, venous return, and blood pressure. These factors modulate Pulse Transit Time (PTT) - the time it takes for the pulse wave to travel from the heart to the wrist.
Because PPG measures the mechanical arrival of the pulse (which is delayed by variable PTT), it inherently contains more variability than the electrical excitation measured by ECG. This phenomenon results in PPG-derived RMSSD being systematically higher than ECG-derived RMSSD, a finding corroborated by separate 2025 studies comparing Polar H10 (ECG) with Polar OH1 (arm-based PPG) [3].
Implications for HRV Research
These findings are convincingly positive for researchers utilizing Garmin devices:
- Enhanced BBI Resolves the Reported Primary Bias: The problematic pattern of underestimating high RMSSD seen in legacy systems is eliminated with eBBI.
- The Offset is Physiological: The remaining positive offset reflects real physiological differences between optical wrist sensing (PRV) and electrical chest sensing (HRV), rather than algorithmic failure.
- Quality Control is Critical: As highlighted in our previous work, the key to research-grade data is excluding low-confidence beats.
Conclusion: Enhanced BBI Elevates Wearable HRV to Research-Grade Reliability
The analysis presented here confirms that the transition from legacy BBI to Enhanced BBI significantly mitigates the systematic biases previously reported in Garmin-derived nightly RMSSD. eBBI yields data that more closely mirrors raw pulse peak intervals, distinguishing physiological Pulse Rate Variability from algorithmic artifacts. When combined with Labfront’s seamless integration - offering automatic syncing, confidence-based filtering, and advanced analytics - researchers can confidently deploy Garmin devices for precise studies.
For the research community, these findings emphasize the importance of data granularity over pre-calculated metrics. Platforms like Labfront facilitate access to these raw intervals and confidence flags, enabling investigators to apply independent quality control criteria essential for rigorous analysis. Consequently, when appropriate filtering is applied to Enhanced BBI data, modern Garmin sensors offer a viable, scalable alternative to chest-based ECG for longitudinal autonomic monitoring.
FAQ
Reference
- Dial, M. B., Hollander, M. E., Vatne, E. A., Emerson, A. M., Edwards, N. A., & Hagen, J. A. (2025). Validation of nocturnal resting heart rate and heart rate variability in consumer wearables. Physiological reports, 13(16), e70527. https://doi.org/10.14814/phy2.70527
- www8.garmin.com/garminhealth/news/Garmin-Enhanced-BBI_Final.pdf
- Miller, D. J., Sargent, C., & Roach, G. D. (2022). A Validation of Six Wearable Devices for Estimating Sleep, Heart Rate and Heart Rate Variability in Healthy Adults. Sensors (Basel, Switzerland), 22(16), 6317. https://doi.org/10.3390/s22166317
- Coste, A., Millour, G., & Hausswirth, C. (2025). A Comparative Study Between ECG- and PPG-Based Heart Rate Sensors for Heart Rate Variability Measurements: Influence of Body Position, Duration, Sex, and Age. Sensors (Basel, Switzerland), 25(18), 5745. https://doi.org/10.3390/s25185745

Han-Ping is the senior research lead (and chief plant caretaker) at Labfront, specializing in physiological data analysis. An alumnus of the BIDMC/Harvard's Center for Dynamical Biomarkers, Han-Ping uses his PhD in electrophysics to help Labfront customers convert raw physiological data into health insights. He does his best Python coding while powered by arm massages from his spiky-tongued cat, Pi.
.svg)


.webp)


.svg)