

Abstract
MEMS accelerometers (MA) and piezoelectric accelerometers (PA) are two kinds of popular sensors to measure movement acceleration (ACC) in wearable devices. For example, Motionlogger Sleep Watch (AMI, NY) and Actiwatch-2 (Phillips-Respironics, Bend, Oregon) apply PA to measure motion during sleep and derive sleep quality. In general, PA is more sensitive in detecting small motions and thus is more expensive than MA. On the other hand, PA is not sensitive to gravity, which makes PA more sensitive to motion that is not along the gravity axis.
This document briefly introduces the mechanism of MEMS accelerometers (MA) and piezoelectric accelerometers (PA), then compares the differences. By applying a moving average filter to remove the gravity bias on each of the x,y, and z-axis ACC, the performance of MA would be similar to PA. Furthermore, we observed that cheap and easily obtained MA and PA devices are both sensitive to detecting small motions during sleep, including twitching fingers.
1. Mechanism of PA & MA, and their differences
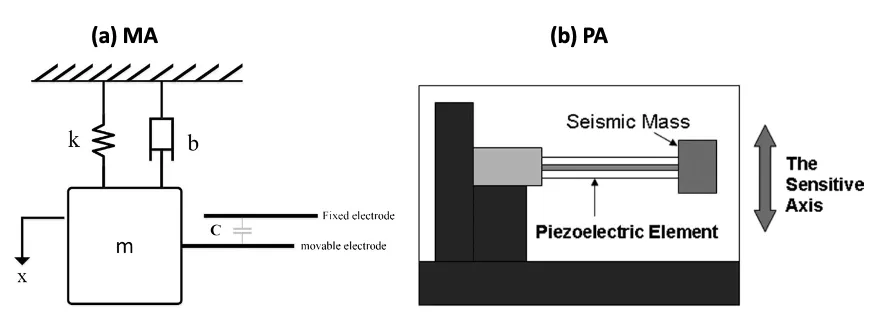
1.1 Mechanism of MA
The schematic is shown in Figure 1(a). When the sensor is exposed to acceleration, a force equal to the mass multiplied by the acceleration is applied to the proof mass and causes it to be displaced. This displacement changes the capacitor’s gap size, leading to variations in capacitance. These variations in capacitance can be attributed to the applied acceleration [1].
1.2 Mechanism of PA
In the case of a beam configuration, the schematic is shown in Figure 1(b). When the sensor undergoes acceleration, the seismic mass causes the piezoelectric element to bend and then generate a voltage signal that is proportional to the applied acceleration. The piezoelectric element is the most sensitive in the bending direction; hence it is often referred to as uniaxial. However, deformations in other directions or planes can also result in acceleration signals. Some define this type of piezoelectric sensor as omnidirectional, which means it senses accelerations not only in the axis of bending (e.g., vertical to ground) but also in the other planes or directions (horizontal and lateral).
A major limitation of most piezoelectric accelerometers is that they can only reliably be used to detect dynamic events. This is due to a phenomenon known as “leakage,” which occurs when the initial change in charge in the piezoelectric element dissipates in time, even if the static loading that caused the initial change is still present [2].
1.3 Differences between MA & PA
In general, PA is more sensitive in detecting small motions and thus is more expensive than MA [3]. This may be why some widely used actigraph devices prefer the PA, such as Motionlogger Sleep Watch (AMI, NY) and Actiwatch-2 (Phillips-Respironics, Bend, Oregon).
Due to the limitation of only detecting dynamic events for PA, it is not able to detect static motion or force like gravity. However, the not uniform gravity components on the x,y, and z-axis of MA would make MA not sensitive to motion that is not along the gravity axis.
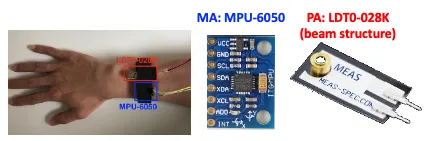
2. Experiment Setup
Our experiment setup of accelerometers is shown in Figure 2. The PA and MA were worn simultaneously during sleep for comparison. The two sensors are both less than 4$ USD.
3. Example of Gravity Bias in MA and Correction
Figure 3 shows the acceleration signals from PA and MA during 2:00 – 4:00. Since it is a stable sleep period, the baseline of PA acceleration is near 0. On the other hand, the baseline of the raw acceleration data from the MA ax, ay, and az are different due to the corresponding gravity component. The gravity is mainly on the z-axis, as az has the largest baseline value. As a result, the overall acceleration a is most similar to az compared to ax and ay, labeled as hollow blue circles in Figure 3. Although there are more motions in ay (purples regions) than those in ax and az, these motions can hardly be recognized in the overall MA acceleration a but can be easily found in the PA acceleration.
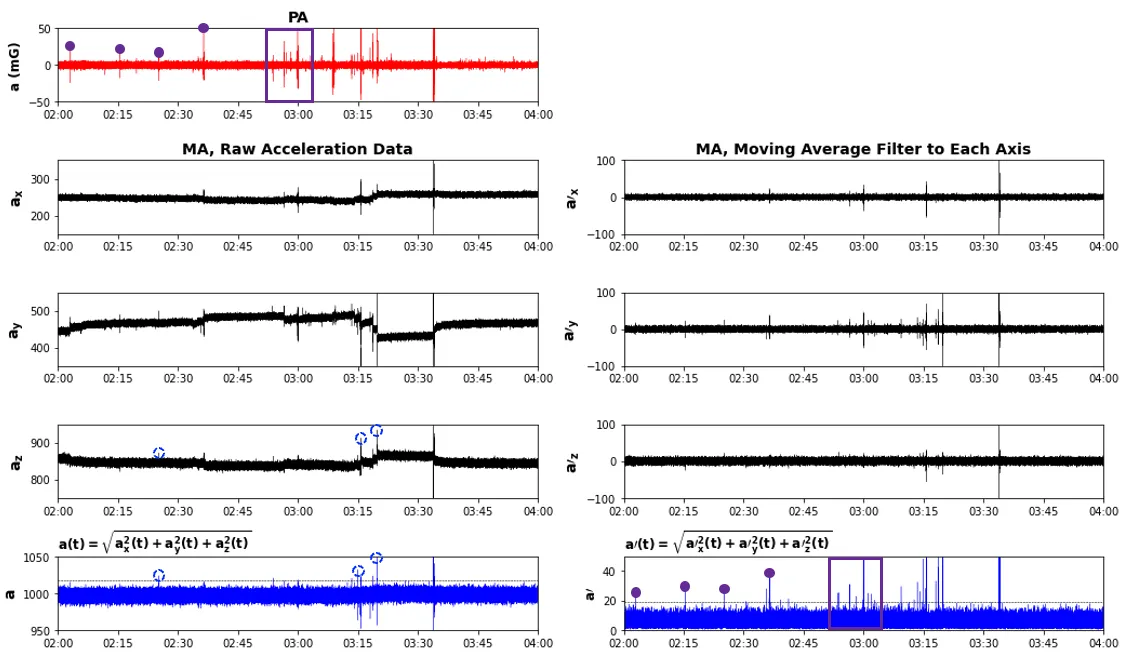
For comparison, by applying a moving average filter to each of the MA’s x,y, and z-axis ACC, we can remove the gravity bias on each axis and make the overall 3-axis ACC more sensitive to movements along an arbitrary direction. As a result, the slight motion in MA a’ labeled in purple is more similar to the purple labeled in PA’s ACC.
4. Small Motion Detection
Figure 4 shows the 5 seconds ACC signals from strong to tiny hand movements with videos. The participant woke up around 2:20, so there were strong movements like rising and sliding hands with ACC peak amplitude much larger than the 4SD threshold in the dashed line. On the other hand, around 2:40-3:00, the participant sleep not tight, and thus there were some small movements like a tremoring hand and twitching finger. It can be seen that both the common PA and MA in this experiment are sensitive to detecting small motions during sleep.
5. References
[1] M. Keshavarzi and J. Yavand Hasani, "Design and optimization of fully differential capacitive MEMS accelerometer based on surface micromachining," Microsystem Technologies, vol. 25, no. 4, pp. 1369-1377, 2019.
[2] K. Y. Chen and D. R. Bassett, “The technology of accelerometry-based activity monitors: current and future,” Med. Sci. Sports Exer., vol. 37, pp. S490–S500, Nov. 2005.
[3] C. Murphy, "Why MEMS Accelerometers Are Becoming the Designer’s Best Choice for CbM Applications," Analog Devices, 2021.

Han-Ping is the senior research lead (and chief plant caretaker) at Labfront, specializing in physiological data analysis. An alumnus of the BIDMC/Harvard's Center for Dynamical Biomarkers, Han-Ping uses his PhD in electrophysics to help Labfront customers convert raw physiological data into health insights. He does his best Python coding while powered by arm massages from his spiky-tongued cat, Pi.

Francis is a research Lead at Labfront, responsible for data validation and analysis. He is interested in applying physics or math to medical research.

Dr. Ahn is an internal medicine physician with a background in physics/engineering and physiological signal analyses. He is the Chief Medical Officer at Labfront and an Assistant Professor in Medicine & Radiology at Harvard Medical School. Dr. Ahn is passionate about democratizing health sciences and exploring health from an anti-disciplinary perspective.
.svg)


.webp)


.svg)